

TradingView has officially expanded its tick chart support, bringing near-complete tick data coverage to almost all exchanges and instruments on the platform.
Initially launched in beta for select markets, tick charts are now available for most symbols — excluding only:
- Indices with no volume
- Options
- Government bonds (TVC:)
- End-of-Day (EOD) instruments
What Are Tick Charts?
Unlike time-based charts, tick charts build bars based on a set number of transactions. This makes them ideal for active traders, especially during volatile periods when rapid price movement needs a clearer lens.
- Available for Expert and Ultimate plan users
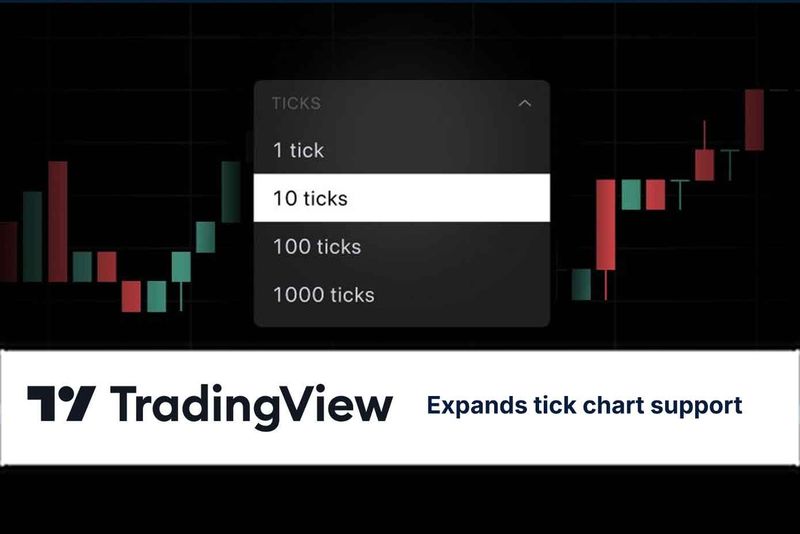
- Supported intervals: 1T, 10T, 100T, 1000T
Traders can access tick charts by typing the desired interval (e.g. “100T”) or selecting it from the time dropdown menu.
The PropInsider Take
Tick charts are especially popular among funded and challenge-phase prop traders, who rely on detailed price action and low-latency entries.
TradingView’s broader support makes it more competitive as a primary execution and analysis platform — and gives prop firms another reason to include it in their evaluation or funded packages.